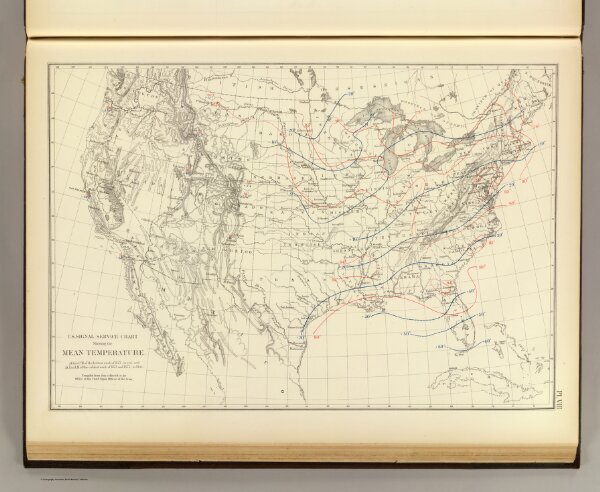
U.S. Signal Service chart showing the mean temperature. At 4.35 P.M. of the hottest week of 1872, in red, and at 7.35 A.M. of the coldest week of 1872 and 1873, in blue. Compiled from data collected at the Office of the Chief Signal Officer of the Army. (Julius Bien, Lith., 1874)